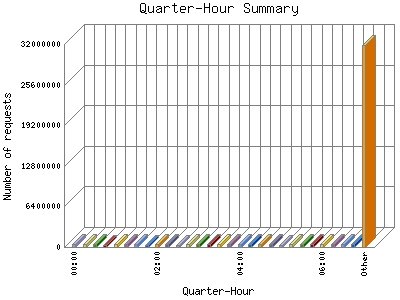
The Quarter-Hour Summary shows an overview of site activity over the course of a day, broken down into fifteen-minute intervals. If your report has enough traffic this will give you a detailed graph of your site's load throughout the day.
| Quarter-Hour | Number of requests | Percentage of the requests | |
|---|---|---|---|
| 1. | 00:00 | 467,551 | 0.90% |
| 2. | 00:15 | 507,694 | 0.99% |
| 3. | 00:30 | 532,039 | 1.3% |
| 4. | 00:45 | 470,521 | 0.91% |
| 5. | 01:00 | 473,543 | 0.91% |
| 6. | 01:15 | 476,383 | 0.92% |
| 7. | 01:30 | 465,191 | 0.90% |
| 8. | 01:45 | 457,742 | 0.89% |
| 9. | 02:00 | 489,240 | 0.94% |
| 10. | 02:15 | 479,748 | 0.93% |
| 11. | 02:30 | 448,293 | 0.87% |
| 12. | 02:45 | 496,607 | 0.97% |
| 13. | 03:00 | 485,446 | 0.94% |
| 14. | 03:15 | 540,534 | 1.4% |
| 15. | 03:30 | 550,518 | 1.7% |
| 16. | 03:45 | 545,291 | 1.6% |
| 17. | 04:00 | 566,076 | 1.10% |
| 18. | 04:15 | 514,446 | 0.100% |
| 19. | 04:30 | 496,416 | 0.97% |
| 20. | 04:45 | 476,386 | 0.92% |
| 21. | 05:00 | 462,133 | 0.90% |
| 22. | 05:15 | 491,954 | 0.96% |
| 23. | 05:30 | 590,691 | 1.14% |
| 24. | 05:45 | 520,060 | 1% |
| 25. | 06:00 | 500,047 | 0.97% |
| 26. | 06:15 | 555,724 | 1.8% |
| 27. | 06:30 | 570,418 | 1.10% |
| 28. | 06:45 | 543,612 | 1.6% |
| 29. | 07:00 | 604,401 | 1.18% |
| 30. | 07:15 | 595,122 | 1.16% |
| 31. | 07:30 | 557,909 | 1.9% |
| 32. | 07:45 | 577,892 | 1.12% |
| 33. | 08:00 | 575,299 | 1.11% |
| 34. | 08:15 | 525,272 | 1.1% |
| 35. | 08:30 | 556,724 | 1.8% |
| 36. | 08:45 | 602,836 | 1.17% |
| 37. | 09:00 | 521,276 | 1.1% |
| 38. | 09:15 | 552,792 | 1.8% |
| 39. | 09:30 | 538,692 | 1.4% |
| 40. | 09:45 | 567,123 | 1.10% |
| 41. | 10:00 | 527,402 | 1.2% |
| 42. | 10:15 | 527,735 | 1.2% |
| 43. | 10:30 | 536,867 | 1.4% |
| 44. | 10:45 | 530,403 | 1.2% |
| 45. | 11:00 | 524,962 | 1.1% |
| 46. | 11:15 | 573,992 | 1.11% |
| 47. | 11:30 | 582,310 | 1.12% |
| 48. | 11:45 | 530,940 | 1.2% |
| 49. | 12:00 | 590,792 | 1.14% |
| 50. | 12:15 | 579,088 | 1.12% |
| 51. | 12:30 | 574,455 | 1.11% |
| 52. | 12:45 | 533,524 | 1.3% |
| 53. | 13:00 | 588,580 | 1.14% |
| 54. | 13:15 | 557,112 | 1.9% |
| 55. | 13:30 | 526,535 | 1.2% |
| 56. | 13:45 | 566,953 | 1.10% |
| 57. | 14:00 | 527,926 | 1.2% |
| 58. | 14:15 | 524,999 | 1.1% |
| 59. | 14:30 | 559,396 | 1.9% |
| 60. | 14:45 | 551,795 | 1.7% |
| 61. | 15:00 | 642,280 | 1.24% |
| 62. | 15:15 | 583,162 | 1.13% |
| 63. | 15:30 | 574,995 | 1.11% |
| 64. | 15:45 | 551,421 | 1.7% |
| 65. | 16:00 | 575,214 | 1.11% |
| 66. | 16:15 | 609,192 | 1.19% |
| 67. | 16:30 | 606,356 | 1.18% |
| 68. | 16:45 | 555,688 | 1.8% |
| 69. | 17:00 | 538,571 | 1.4% |
| 70. | 17:15 | 570,768 | 1.10% |
| 71. | 17:30 | 632,964 | 1.22% |
| 72. | 17:45 | 552,558 | 1.8% |
| 73. | 18:00 | 570,193 | 1.10% |
| 74. | 18:15 | 539,406 | 1.4% |
| 75. | 18:30 | 548,733 | 1.7% |
| 76. | 18:45 | 609,383 | 1.19% |
| 77. | 19:00 | 533,600 | 1.3% |
| 78. | 19:15 | 548,618 | 1.7% |
| 79. | 19:30 | 575,561 | 1.11% |
| 80. | 19:45 | 565,848 | 1.10% |
| 81. | 20:00 | 578,173 | 1.12% |
| 82. | 20:15 | 517,480 | 1% |
| 83. | 20:30 | 576,197 | 1.11% |
| 84. | 20:45 | 551,043 | 1.7% |
| 85. | 21:00 | 537,935 | 1.4% |
| 86. | 21:15 | 530,844 | 1.2% |
| 87. | 21:30 | 501,358 | 0.98% |
| 88. | 21:45 | 489,101 | 0.94% |
| 89. | 22:00 | 498,145 | 0.97% |
| 90. | 22:15 | 486,664 | 0.94% |
| 91. | 22:30 | 508,360 | 0.99% |
| 92. | 22:45 | 515,442 | 0.100% |
| 93. | 23:00 | 464,092 | 0.90% |
| 94. | 23:15 | 450,179 | 0.88% |
| 95. | 23:30 | 491,654 | 0.96% |
| 96. | 23:45 | 458,777 | 0.89% |
This report was generated on September 17, 2025 01:33.
Report time frame August 14, 2022 00:00 to September 16, 2025 04:59.
| Web statistics report produced by: | |
 Analog 5.24 Analog 5.24 |  Report Magic for Analog 2.13 Report Magic for Analog 2.13 |