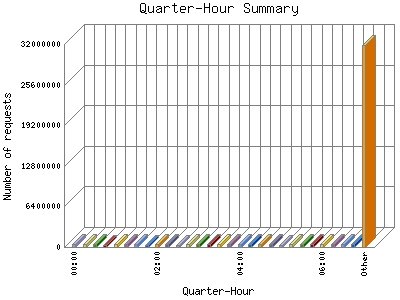
The Quarter-Hour Summary shows an overview of site activity over the course of a day, broken down into fifteen-minute intervals. If your report has enough traffic this will give you a detailed graph of your site's load throughout the day.
| Quarter-Hour | Number of requests | Percentage of the requests | |
|---|---|---|---|
| 1. | 00:00 | 182,974 | 0.89% |
| 2. | 00:15 | 218,394 | 1.6% |
| 3. | 00:30 | 182,602 | 0.89% |
| 4. | 00:45 | 179,115 | 0.87% |
| 5. | 01:00 | 208,968 | 1% |
| 6. | 01:15 | 188,898 | 0.91% |
| 7. | 01:30 | 209,319 | 1.1% |
| 8. | 01:45 | 171,507 | 0.82% |
| 9. | 02:00 | 176,255 | 0.86% |
| 10. | 02:15 | 210,554 | 1.1% |
| 11. | 02:30 | 208,716 | 1% |
| 12. | 02:45 | 185,348 | 0.90% |
| 13. | 03:00 | 179,215 | 0.87% |
| 14. | 03:15 | 181,895 | 0.88% |
| 15. | 03:30 | 186,923 | 0.90% |
| 16. | 03:45 | 182,221 | 0.89% |
| 17. | 04:00 | 223,248 | 1.8% |
| 18. | 04:15 | 185,987 | 0.90% |
| 19. | 04:30 | 188,936 | 0.91% |
| 20. | 04:45 | 204,676 | 0.99% |
| 21. | 05:00 | 173,370 | 0.83% |
| 22. | 05:15 | 195,900 | 0.94% |
| 23. | 05:30 | 220,387 | 1.7% |
| 24. | 05:45 | 173,782 | 0.83% |
| 25. | 06:00 | 201,928 | 0.98% |
| 26. | 06:15 | 211,330 | 1.2% |
| 27. | 06:30 | 250,646 | 1.21% |
| 28. | 06:45 | 215,945 | 1.4% |
| 29. | 07:00 | 641,957 | 3.10% |
| 30. | 07:15 | 297,721 | 1.43% |
| 31. | 07:30 | 196,510 | 0.94% |
| 32. | 07:45 | 192,744 | 0.93% |
| 33. | 08:00 | 189,206 | 0.91% |
| 34. | 08:15 | 199,397 | 0.97% |
| 35. | 08:30 | 188,833 | 0.91% |
| 36. | 08:45 | 222,776 | 1.8% |
| 37. | 09:00 | 188,363 | 0.91% |
| 38. | 09:15 | 191,744 | 0.92% |
| 39. | 09:30 | 223,253 | 1.8% |
| 40. | 09:45 | 194,786 | 0.94% |
| 41. | 10:00 | 194,365 | 0.93% |
| 42. | 10:15 | 211,987 | 1.2% |
| 43. | 10:30 | 199,782 | 0.97% |
| 44. | 10:45 | 203,311 | 0.99% |
| 45. | 11:00 | 195,641 | 0.94% |
| 46. | 11:15 | 199,697 | 0.97% |
| 47. | 11:30 | 206,552 | 0.100% |
| 48. | 11:45 | 192,397 | 0.92% |
| 49. | 12:00 | 207,542 | 1% |
| 50. | 12:15 | 209,564 | 1.1% |
| 51. | 12:30 | 205,420 | 0.100% |
| 52. | 12:45 | 183,736 | 0.89% |
| 53. | 13:00 | 251,827 | 1.21% |
| 54. | 13:15 | 207,012 | 1% |
| 55. | 13:30 | 202,190 | 0.98% |
| 56. | 13:45 | 199,105 | 0.97% |
| 57. | 14:00 | 210,057 | 1.1% |
| 58. | 14:15 | 204,045 | 0.99% |
| 59. | 14:30 | 239,396 | 1.16% |
| 60. | 14:45 | 216,312 | 1.4% |
| 61. | 15:00 | 225,723 | 1.10% |
| 62. | 15:15 | 225,123 | 1.9% |
| 63. | 15:30 | 264,107 | 1.28% |
| 64. | 15:45 | 265,594 | 1.29% |
| 65. | 16:00 | 237,987 | 1.14% |
| 66. | 16:15 | 228,814 | 1.10% |
| 67. | 16:30 | 227,223 | 1.10% |
| 68. | 16:45 | 225,943 | 1.10% |
| 69. | 17:00 | 238,963 | 1.16% |
| 70. | 17:15 | 249,474 | 1.20% |
| 71. | 17:30 | 249,500 | 1.20% |
| 72. | 17:45 | 278,267 | 1.34% |
| 73. | 18:00 | 231,765 | 1.11% |
| 74. | 18:15 | 226,976 | 1.10% |
| 75. | 18:30 | 222,731 | 1.8% |
| 76. | 18:45 | 237,806 | 1.14% |
| 77. | 19:00 | 227,020 | 1.10% |
| 78. | 19:15 | 218,445 | 1.6% |
| 79. | 19:30 | 267,339 | 1.30% |
| 80. | 19:45 | 307,434 | 1.49% |
| 81. | 20:00 | 260,026 | 1.26% |
| 82. | 20:15 | 204,015 | 0.99% |
| 83. | 20:30 | 216,326 | 1.4% |
| 84. | 20:45 | 242,393 | 1.18% |
| 85. | 21:00 | 205,751 | 0.100% |
| 86. | 21:15 | 197,743 | 0.96% |
| 87. | 21:30 | 178,221 | 0.87% |
| 88. | 21:45 | 190,063 | 0.91% |
| 89. | 22:00 | 186,915 | 0.90% |
| 90. | 22:15 | 182,610 | 0.89% |
| 91. | 22:30 | 216,579 | 1.4% |
| 92. | 22:45 | 210,791 | 1.1% |
| 93. | 23:00 | 213,206 | 1.2% |
| 94. | 23:15 | 187,189 | 0.90% |
| 95. | 23:30 | 192,159 | 0.92% |
| 96. | 23:45 | 203,381 | 0.99% |
This report was generated on August 3, 2026 01:32.
Report time frame November 18, 2025 06:00 to August 2, 2026 04:59.
| Web statistics report produced by: | |
 Analog 5.24 Analog 5.24 |  Report Magic for Analog 2.13 Report Magic for Analog 2.13 |